
Build a Pivot Table
Summarize a source range into a live pivot (cross-tab) that is computed and written back into the grid. Introduced in v1.4.
Pro only.
createPivotrequires a validlicenseKey.
Basic usage
Point the pivot at a source range whose first row holds the field headers, choose an anchor cell for the output block, and declare row / column / value fields:
import { createReogrid } from '@reogrid/pro';

const grid = createReogrid('#grid', { licenseKey: 'YOUR-LICENSE-KEY' });
const ws = grid.worksheet;

// Source data in A1:E201 — row 0 = headers: Region, Product, Quarter, Channel, Sales
const pivot = ws.createPivot({
  source: { row: 0, col: 0, rows: 201, columns: 5 }, // top-left + counts (header row included)
  anchor: { row: 0, column: 6 },                     // render the block starting at G1
  rows:    [{ field: 'Region' }],
  columns: [{ field: 'Product' }],
  values:  [{ field: 'Sales', agg: 'sum', numberFormat: '#,##0' }],
});

console.log(pivot.id);     // stable id
console.log(pivot.bounds); // the RangePosition the output currently occupies
Grand-total row and column are added by default (showRowGrandTotals / showColumnGrandTotals), and the output cells are locked.
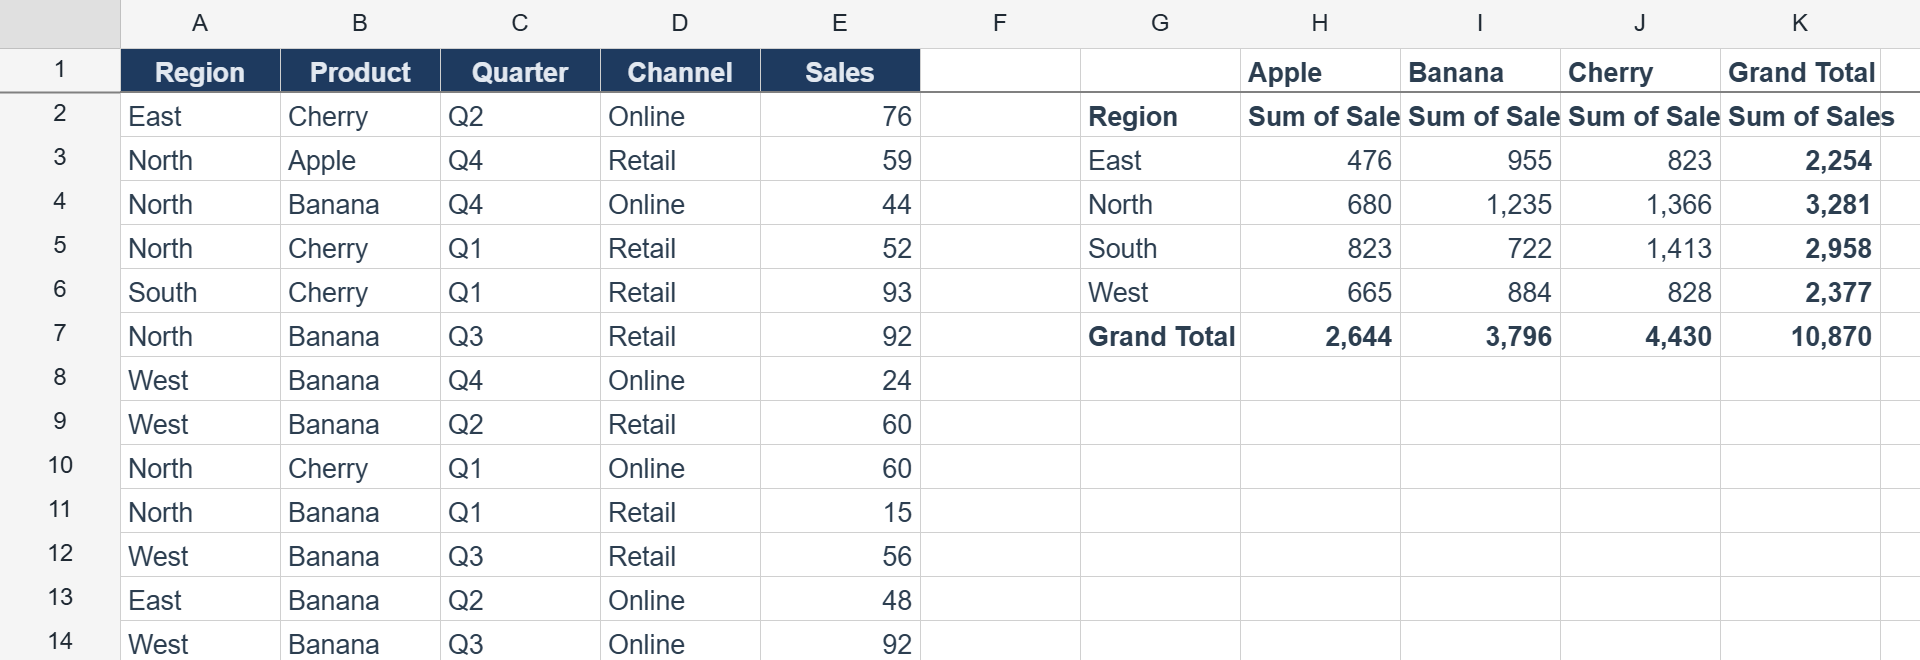
Aggregations and multiple measures
agg is one of 'sum', 'count', 'countNumbers', 'average', 'max', 'min', 'product'. You can list several value fields:
ws.createPivot({
  source: { row: 0, col: 0, rows: 201, columns: 5 },
  anchor: { row: 0, column: 6 },
  rows:   [{ field: 'Region' }],
  values: [
    { field: 'Sales', agg: 'sum',     caption: 'Total sales', numberFormat: '#,##0' },
    { field: 'Sales', agg: 'average', caption: 'Avg sale',    numberFormat: '#,##0.0' },
  ],
});
Filter which records feed the pivot
ws.createPivot({
  source: { row: 0, col: 0, rows: 201, columns: 5 },
  anchor: { row: 0, column: 6 },
  rows:    [{ field: 'Region' }],
  values:  [{ field: 'Sales', agg: 'sum' }],
  filters: [{ field: 'Channel', include: ['Online'] }], // Online records only
});
Update, refresh, remove
createPivot returns a PivotHandle:
pivot.update({ columns: [{ field: 'Quarter' }] }); // merge changes + recompute
pivot.refresh();                                    // force a recompute from source
pivot.remove();                                     // clear the block + drop the pivot
The same operations exist by id on the worksheet: ws.getPivot(id), ws.getPivots(), ws.updatePivot(id, partial), ws.refreshPivot(id), ws.removePivot(id).
Refresh after structural edits
A pivot stores its source and anchor as fixed ranges — they do not shift when you insert or delete rows/columns. After a structural edit, re-read the source:
ws.insertRows(5, 3);       // structural edit
ws.refreshPivot(pivot.id); // re-read source and re-render
Editing a value inside the existing source range recomputes the pivot live — only inserts/deletes need the manual refresh.
See also
- Pivot Tables
- Table Styles — format the source range as a banded Excel table
- Number Formatting